Establishing Move on CRAN

On friday, December 14th, we successfully published our software package ‘move’ at CRAN, the popular R repository. This was a huge step for me and my group. We were working on the package, that allows to import, analyze and visualize animal movement data, almost a year. We already published stable versions on r-forge prior to the publication on CRAN.

Thanks to colleagues and users from around the world we received useful feedback to make the package even better. We fixed problems and added further functionality. We now decided that it is time to make the package available to a broader audience. We published at CRAN since it is the primary repository for R packages.

Now, it is possible to download and install the ‘move’ package from within R with:

install.packages("move")

We aim to add further functionalities to the package in the near future. We hope that the package will be useful for biologists in general and movement ecologists in specific.

Transforming UD rasters into contour rasters

Calculating utilization distributions for animals, e.g. with Kernel Density or Dynamic Brownian Bridge Movement Model, result in rasters with probabilities of presence. To calculate areas with equal levels of presence (contours) it is necessary to transform the raster, which is now done by the getVolumeUD  function from the move package.

The function works with objects of the Raster class. This is an advantage over a similar function from the adehabitatHR package (getvolumeUD), which works with objects of the class estUD and estUDm, that are created for example by the kernelUD function from the same package. Allowing objects from the Raster class (raster package) makes the getVolumeUD more flexible.

Using:

new <- getVolumeUD(raster)
contour95 <- new<=0.95

where new is the raster that is returned from getVolumeUD, you calculate a new raster that has only 0 for cells that are outside the 95% contour and 1 for cells that are inside the 95% contour. It represents the 95% contour of the UD.

[A great thank you to Bart Kranstauber that provided the majority of the functions code.]

UD raster to contour raster
Two rasters with UD from the same record. Left: raw output from a DBBMM calculation (probabilities are between 0 and 0.03). Right: transformed raster (cells have now the values of the contour they belong to; values are between 0 and 1).

Home Range Bootstrap function for the Move package

Last week we introduced a further function to the move package. It is called the hrBootstrap() which stands for Home Range Bootstrap. It allows to calculate the area of a minimum convex polygon (abbr. MCP) for a set of locations. A polygon is called convex if it includes all line segments connecting any pair of points (see[1]). The minimum convex polygon is the one with the shortest edge length. Given a number of locations of an animal, e.g. due to GPS recordings, the MCP algorithm returns an area that may represent the home range of that animal.
Nowadays the MCP is scarcely if at all used to calculate home ranges. Kernel Density algorithms and Brownian Bridge Movement Models serve more sophisticated results. The results are much closer to the real observations. Nevertheless, the MCP calculation can still be used to compare own results with older studies.
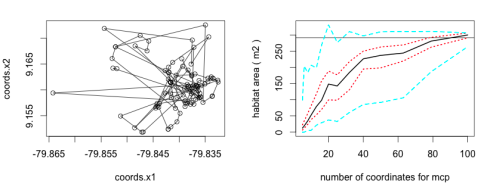
The hrBootstrap() function in our ‘move’ package works for Move and MoveStack objects (individuals or groups of individuals). We implemented here the mcp() and mcp.area() function from the ‘adehabitatHR’ package [2]. We calculate for different number of random locations the mcp. For example for a set of 70 location fixes we calculate the mcp with 5, 6, 8, 10, 13, 16, 20, 25, 32, 40, 50, and 63 locations. Each step is repeated by default 100 times, each time with different locations. The returned data frame represents the calculated mcp area (you can specify the unit with the unout argument) for the according quantiles (0%, 25%, 50%, 75%, 100%) of the values.
By default the quantiles for the different number of locations are plotted as a line plot (see below).
The version will be available, as soon as the r-forge page is back online again.

Image

References

[1] Minimum Conevx Polygon (MCP) http://www.stat.ufl.edu/STA6934/Minimum%20Convex%20Polygon%201%2017%2007.pdf

[2] Home Range Estimation in R: the adehabitatHR Package http://mirrors.fe.up.pt/CRAN/web/packages/adehabitatHR/vignettes/adehabitatHR.pdf

Update fixes WebImport in move package

With the new version of the move package (0.5.4) that we uploaded on Friday many import issues were fixed. We tested the download function with all public available Movebank data sets. As long as the study has no double timestamps per individual ID the studies could be imported. Now, it makes much more fun to interact with the WebImport interface. Just import specific animals from a study to calculate their utilization distribution, UD, or other movement related parameters.

You find more about the move package on our lab page, or direct on r-forge.

Visit as well the Movebank site to see which studies are public available.

Move for Movebank

With a group of computational ecologists I’m working on a package for R. We implement functions that can import various animal track data into R. These data can then be visualized and analyzed. My colleague Bart Kranstauber created the dynamic Brownian Bridge Movement Model (dBBMM) that estimates the UD, utilization distribution, of an animal according to its track. The dBBMM is a part of the ‘move’ package.

The package is available at the r-forge page as a beta version.
More information are available on the ‘move’ package website.